PROVINCETOWN — For years, U.S. Census data have told a consistent story about Provincetown’s rental housing: one of vanishing inventory.

In 1990, the decennial census found 1,009 renter-occupied housing units in Provincetown. The 2000 census found 849 renter-occupied units; the 2010 census found 782 — a 22.5-percent decline in two decades.
The American Community Survey, which is published every year by the U.S. Census Bureau based on continuous sampling of the country’s population, then showed a more precipitous decline: to 611 units in 2014, 573 in 2017, and a drastic loss to just 365 rental units in 2019.
The 2020 decennial census, however, found 837 renter-occupied units in Provincetown. The 2020 American Community Survey reported 427.
Depending on which source one chooses, Provincetown either has lost half the rental housing it had in 2000 or it has lost almost none at all.
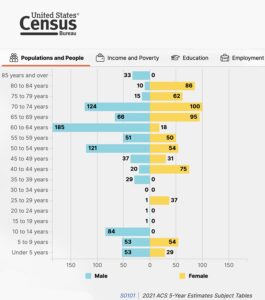
This uncertainty in the data is not confined to Provincetown. A “population tree,” or chart of population by age and sex, that is prominently featured in the Census Bureau’s profile for Truro shows that there are no females in Truro between the ages of 10 and 24. It’s not only the women of Gen Z who are missing: the chart shows no females in their 30s, either.
Apparently, there are few young men around to lament these conditions. The same chart, based on the 2021 American Community Survey, shows Truro having only three male residents between the ages of 15 and 34.
The picture is a little less strange in Wellfleet, where the 2021 American Community Survey reported that more than a quarter of the town’s residents were age 15 to 44. But the supposed gender balance is not credible: Wellfleet is reported to have only 87 males for every 100 females. That is more than double the gender gap in China, where decades of one-child policies (and sex-selective abortion) have created a population with 105 men for every 100 women.
The data for Eastham, meanwhile, show a 21-percent rental housing vacancy rate, according to the 2020 decennial census, with 136 vacant units for rent. In even better supposed news for prospective tenants, fewer than half of Eastham’s renters are paying any rent at all, according to the 2020 American Community Survey.
In some cases, these obviously inaccurate numbers aren’t likely to cause too much confusion in the real world — renters in Eastham are paying rent, one can safely assume.
But figuring out the actual number of rental units in Provincetown or the number of young people in Truro are more difficult questions that don’t lend themselves to guesswork.
For help interpreting these confounding numbers, the Independent consulted Chloe Schaefer, chief planner at the Cape Cod Commission and a custodian of the commission’s online extravaganza of charts and graphs at datacapecod.org.
“I love data, and I try to use it as much as possible,” Schaefer said, “but it’s really important to put it into context. It’s a guide.
“It’s important to think twice about all numbers and make sure you have more than one kind of reference point,” Schaefer added. “Does it make sense with what we’re hearing and what we’re seeing out there? Maybe the numbers aren’t the same, but are they pointing in the same direction?”
Margins of error increase as populations get smaller, Schaefer said, and the Outer Cape’s towns are very small compared to the nation’s cities and counties.
In spite of the anomalies in the data, the decennial census and the American Community Survey are useful, Schaefer said, especially because their methods are consistent across the country and mostly consistent across the decades.
“Data the Census Bureau produces is standardized across geographies and towns, which is very valuable because you can compare one town to another, not just on the Cape but right across the country,” she said. More localized sources of information like a street listing may be more complete, but they could be prepared differently in other jurisdictions, making comparisons difficult.
“That comparability makes census data useful,” Schaefer said, “but it’s still important to pair it with other sources of information to get a more complete picture of what’s happening on the ground.”
In Truro, for example, the street listing, the voter roll, and information from Outer Cape Health Services or the Registry of Motor Vehicles could provide more precise information about how many young people live in town. But the Census Bureau has been counting with more or less the same methods for decades, so its data are good for detecting trends — even when the absolute numbers seem off.
In Provincetown, the town’s list of rental certificates would be a more bespoke source of information about housing — although in an example of local rules affecting the data, the town did not register long-term rentals and short-term rentals separately until just this January.
Schaefer’s overall advice was to be cognizant of which kind of data best suits the question — and to be willing to “ground-truth” data against other sources.
“It’s a challenge whenever you’re working with data,” she said. “When it’s not matching what people are seeing on the ground, you gather as much information as possible and ground-truth it to the extent you’re able.”
In the case of Provincetown’s rentals, the trend lines in U.S. Census data might be more important than any single data point.
But when in doubt, Schaefer said, the answer is always to find more data.


